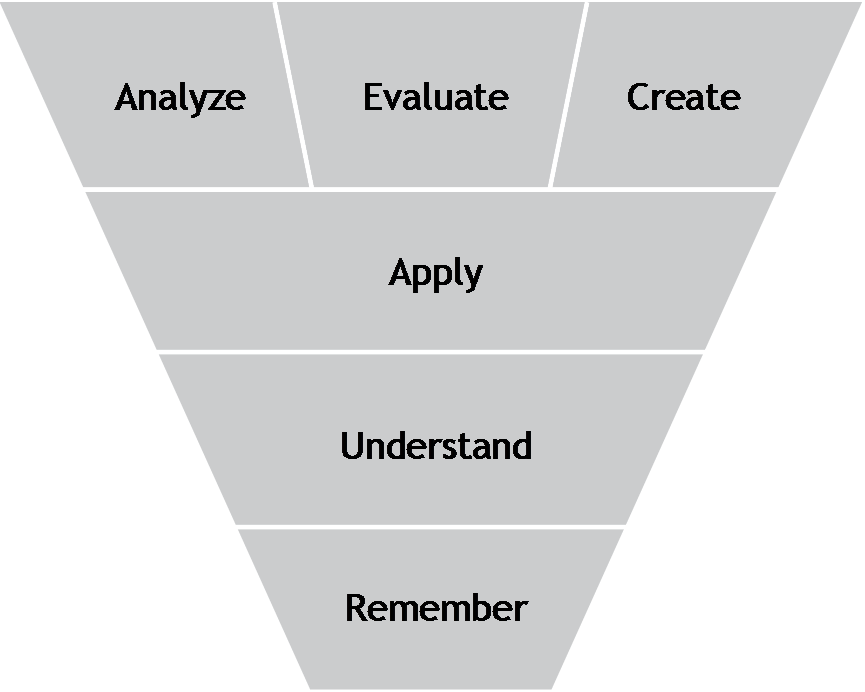
Bloom's Taxonomy
Upon successfully completing this topic's activities, you will be able to:
- Differentiate between weather and climate.
- Explain the effect of climate on life at different periods of Earth's history.
- Interpret graphed data regarding climate change.
- Create data graphs and interpret them regarding climate change in your hometown.
Importance of Climate. This video defines climate, explains numerical charts, and provides examples of the importance of climate.
Carbon Dioxide Change. This video discusses the history of climate change research and discovery of CO2 changes.
Proxy Measures. This video explains climate proxy measures.

MandatorySupplementary
Textbook Chapter 1: Introduction to Global Climate Change.
Textbook Chapter 2: History of Earth's Climate.
The Discovery of Global Warming by Spencer Weart is long, but straightforward.
Global Climate Change Research Explorer explores the scientific data relating to the atmosphere, the oceans, the areas covered by ice and snow, and the living organisms in all these domains. You’ll also get a sense of how scientists study natural phenomena—how researchers gather evidence, test theories, and come to conclusions. There are six pages you can go through on this site.

In Exercise 1, you will examine graphs of Davis average temperatures from satellite and ground stations to determine whether there has been a climate change trend. You will first explore the difference between satellite and ground station data, then examine the difference a running average makes. Lastly, you will compare the difference that different sizes of running averages (5 year, 11 year and 21 year) make.
